

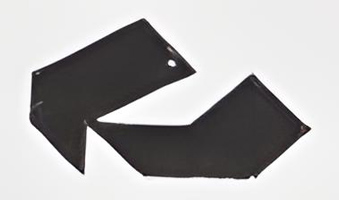
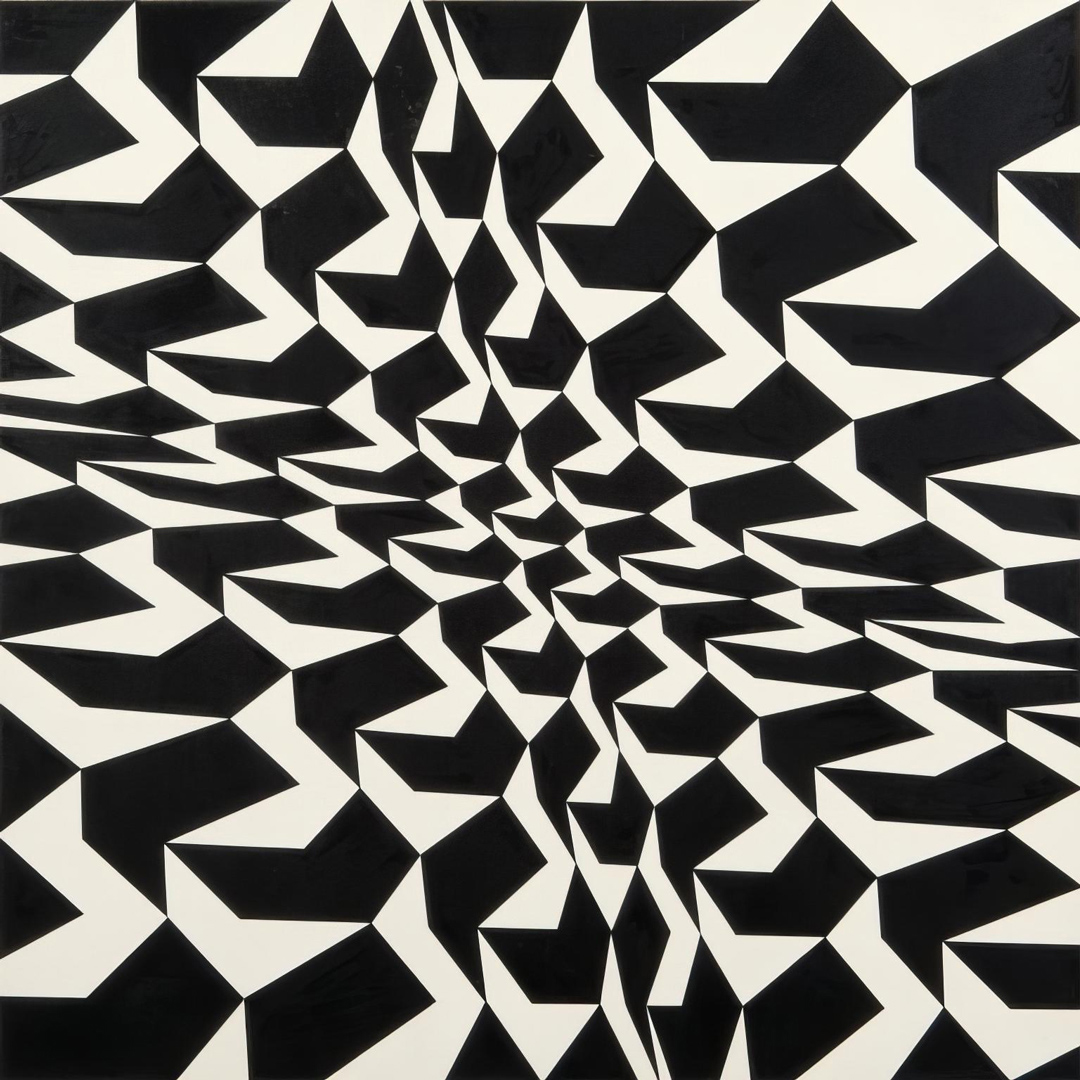
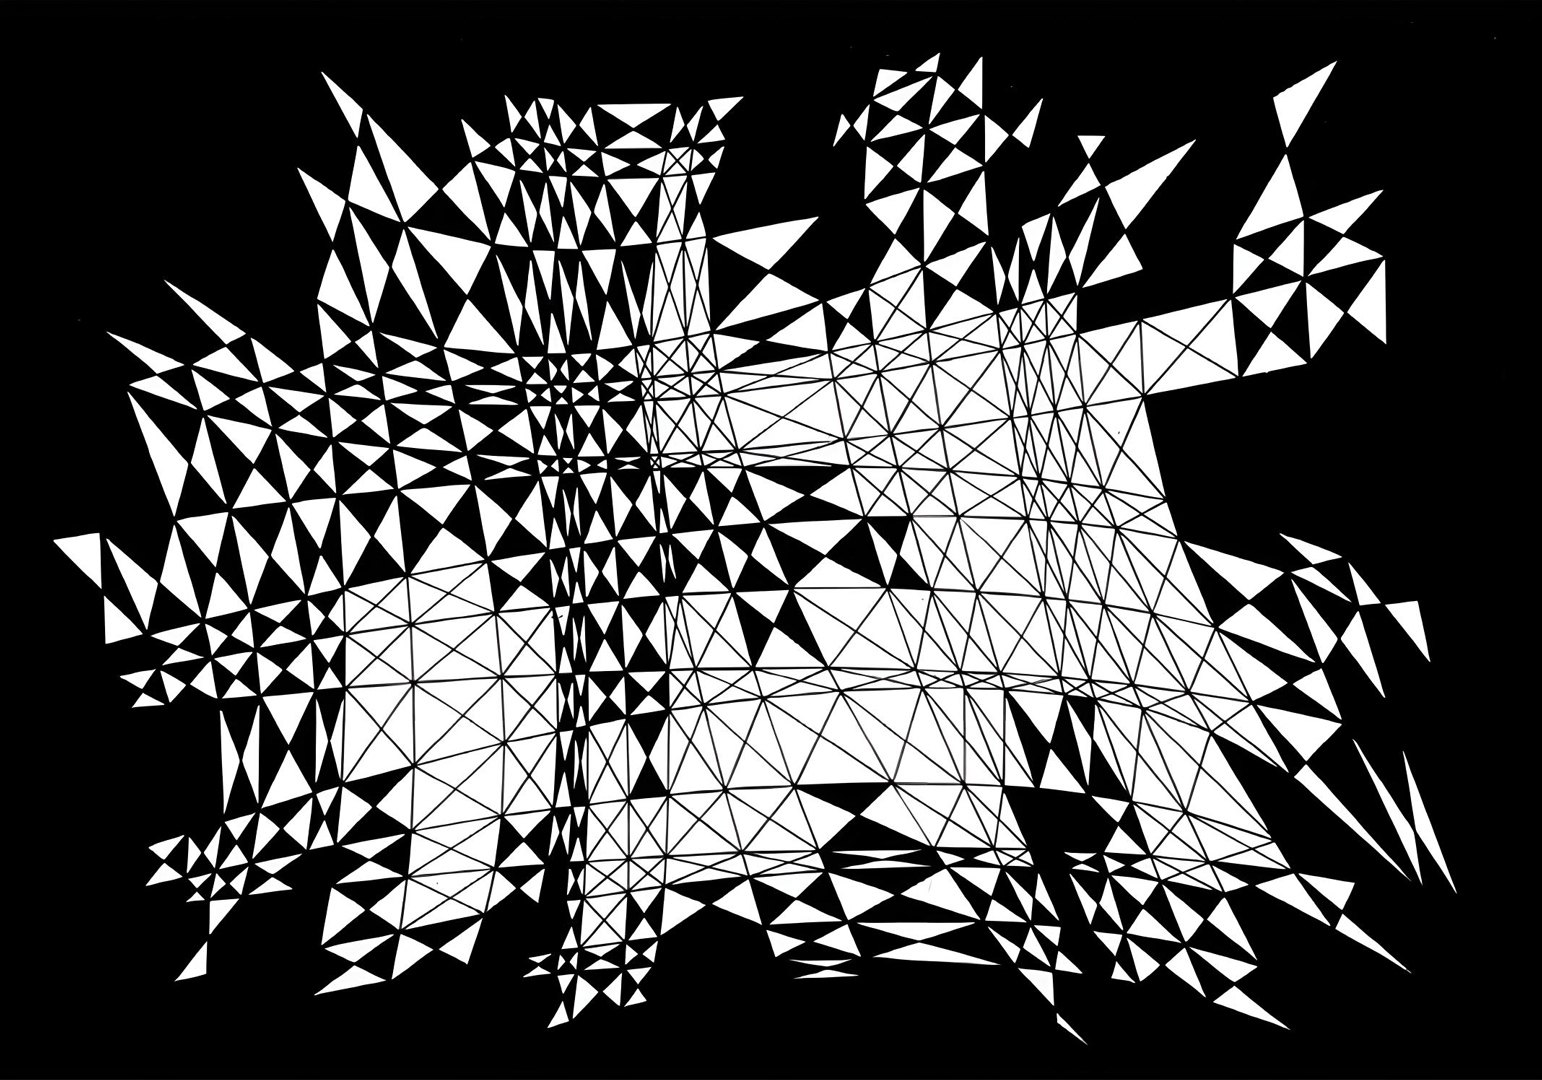
In 1991 at the age of 83, Franco Grignani painted Two hyperbolic corners (Due angoli iperbolici) using black tempera. This painting is presented in a 51×51 cm format on Schoeller cardboard.
Grignani donated this artwork to the painter Lorenzo Piemonti, who was renowned for his involvement in the Madì artistic movement, devoted to pure geometric abstraction. Along with the painting, he included a letter discussing the visual phenomenon of undulatory plastic character.
A living signal for the geometry of the soul.
These two modular signs mutually touch and intersect according to a common support plane.
They give rise, through a graphic system in a progression that starts from the centre and goes out towards the periphery of the painting, to a visual phenomenon of UNDULATORY plastic character.
It is a complex issue due to the particularly ambiguous and spatial position of the bulk and at the same time distorted signs. The applied hyperbolicity stands for multidirectional and three-dimensional exaltation, where the visual perception collected by standing side by side (to the right and to the left), makes the structure live in the sphere of a VIRTUAL DYNAMIC motion.
This work, therefore, communicates a propulsive and continuous spatial system which, for the whole duration of emotion, I call A LIVING SIGNAL FOR THE GEOMETRY OF THE SOUL.

How did Franco achieve such intricate works with just a long ruler, a sharp pencil, and black tempera?
Many still mistakenly believe he used a computer, but – even if recent research revealed an early foray into Computer Graphics in the early 1970s – the closest tool to a computer in his possession was an Olivetti Lexikon 80 typewriter. Indeed in 1981, anticipating the times (the first Apple Macintosh launched onto the market is from 1984), Cesare Musatti, known for introducing Gestalt Psychology to Italy, astutely noted in an exhibition catalogue from Lorenzelli Arte that in Grignani’s artworks …
“everything is calculated, everything is very exact: it is a work which might be the product of a well-programmed operation of processing by a computer.”
This highlights the extraordinary precision and detail Grignani achieved through his manual methods, long before computer technology became widely accessible.
Even now, I’m not able to ‘decrypt’ all of his artworks yet (an achievement that has eluded art critics as well), but this particular piece exhibits some readily identifiable characteristics:
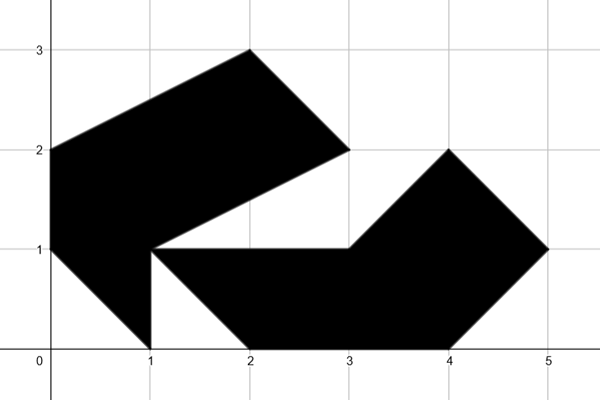
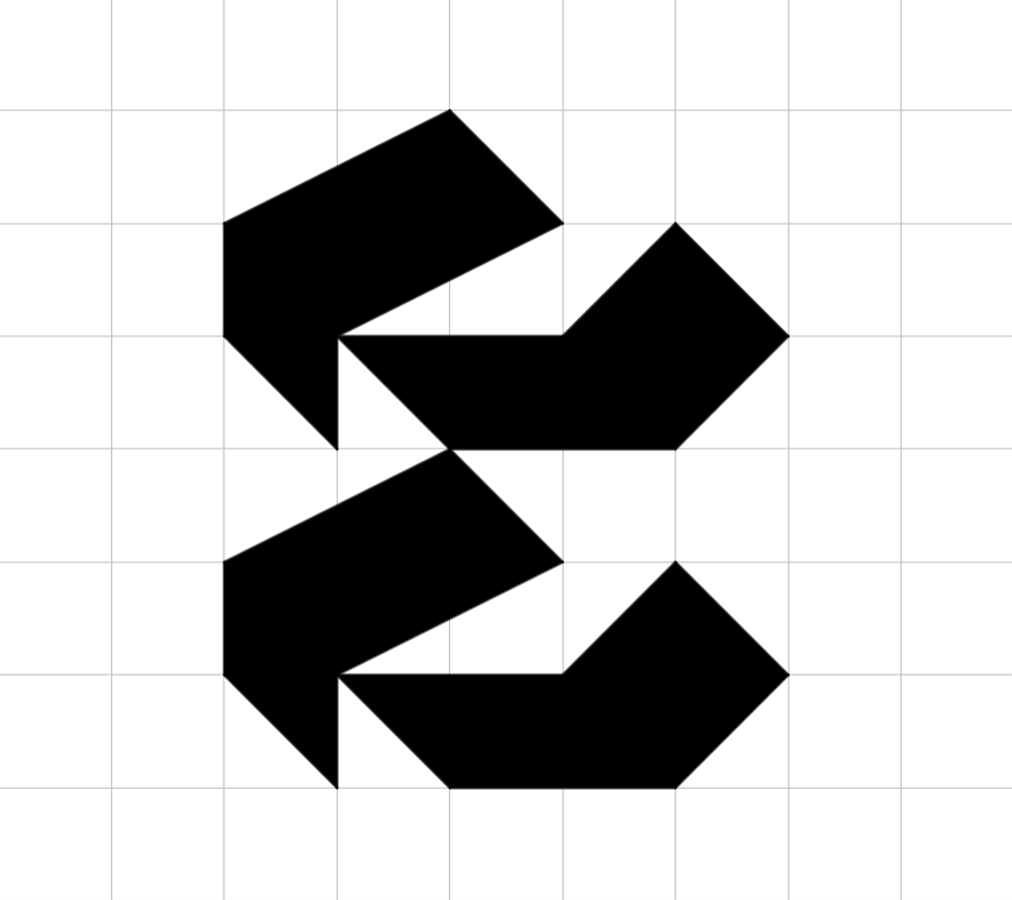
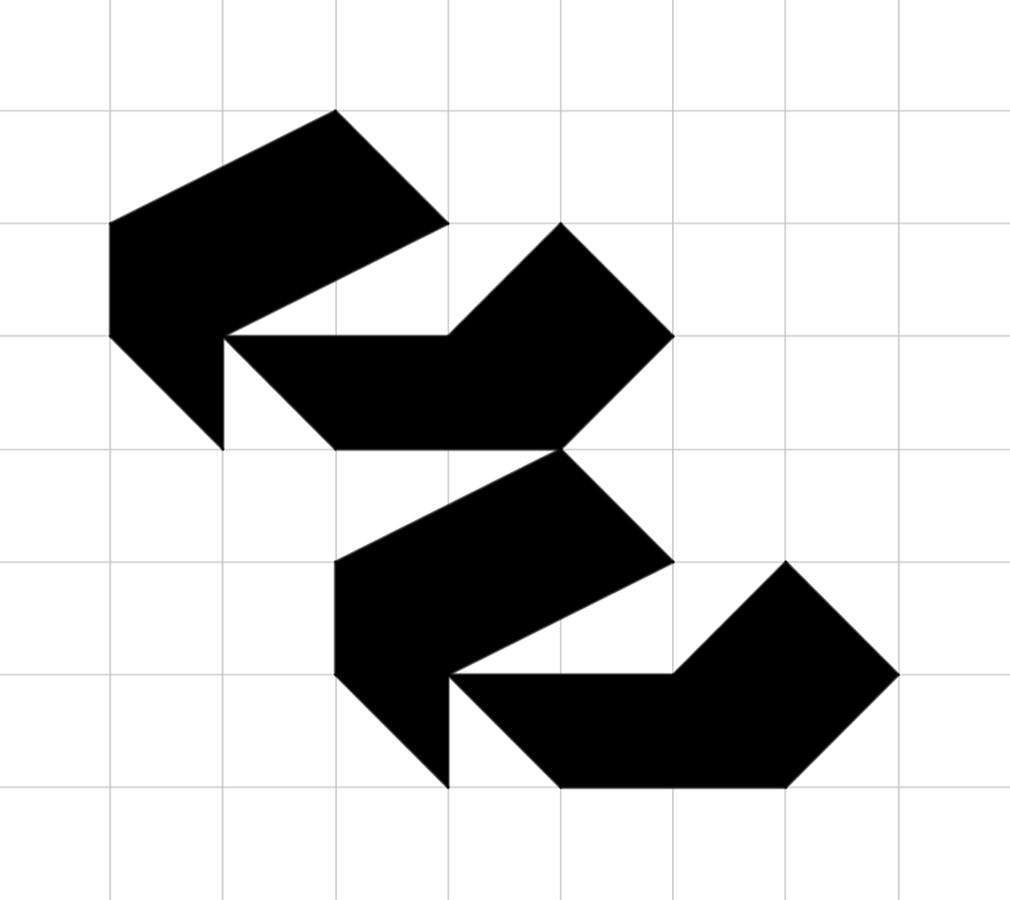
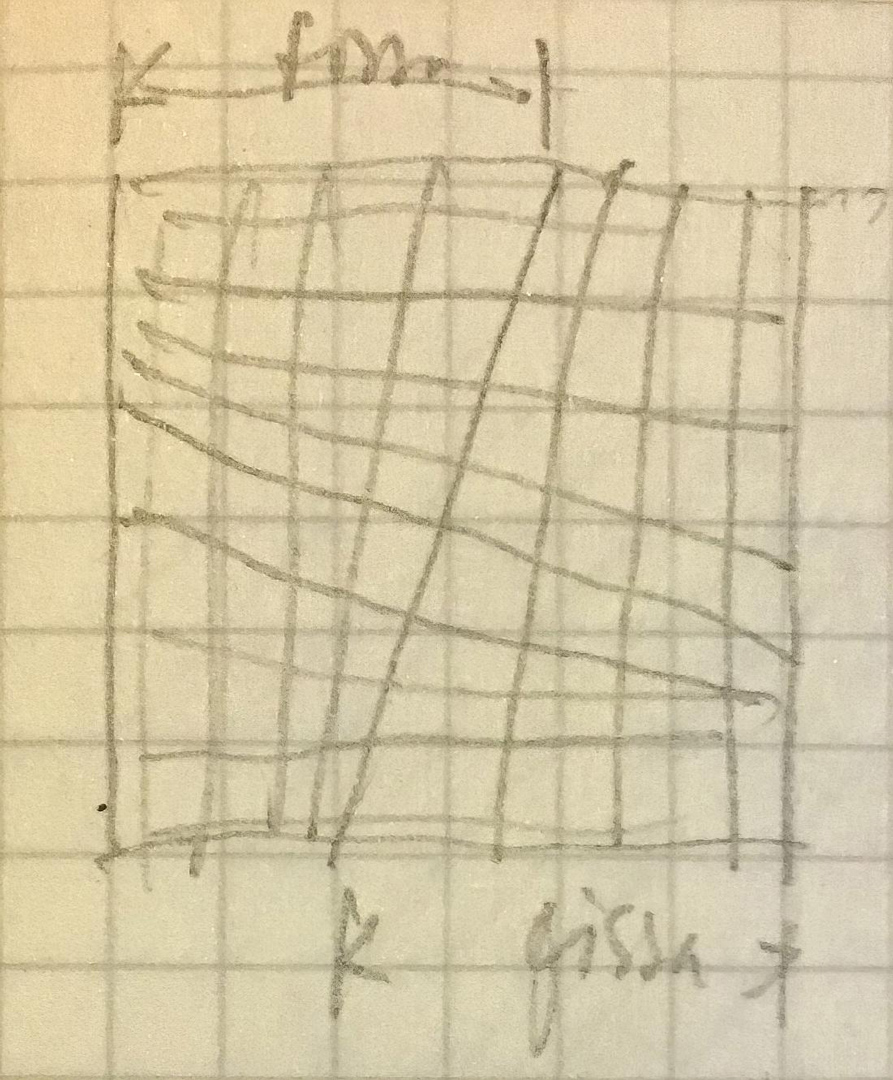
The modular sign
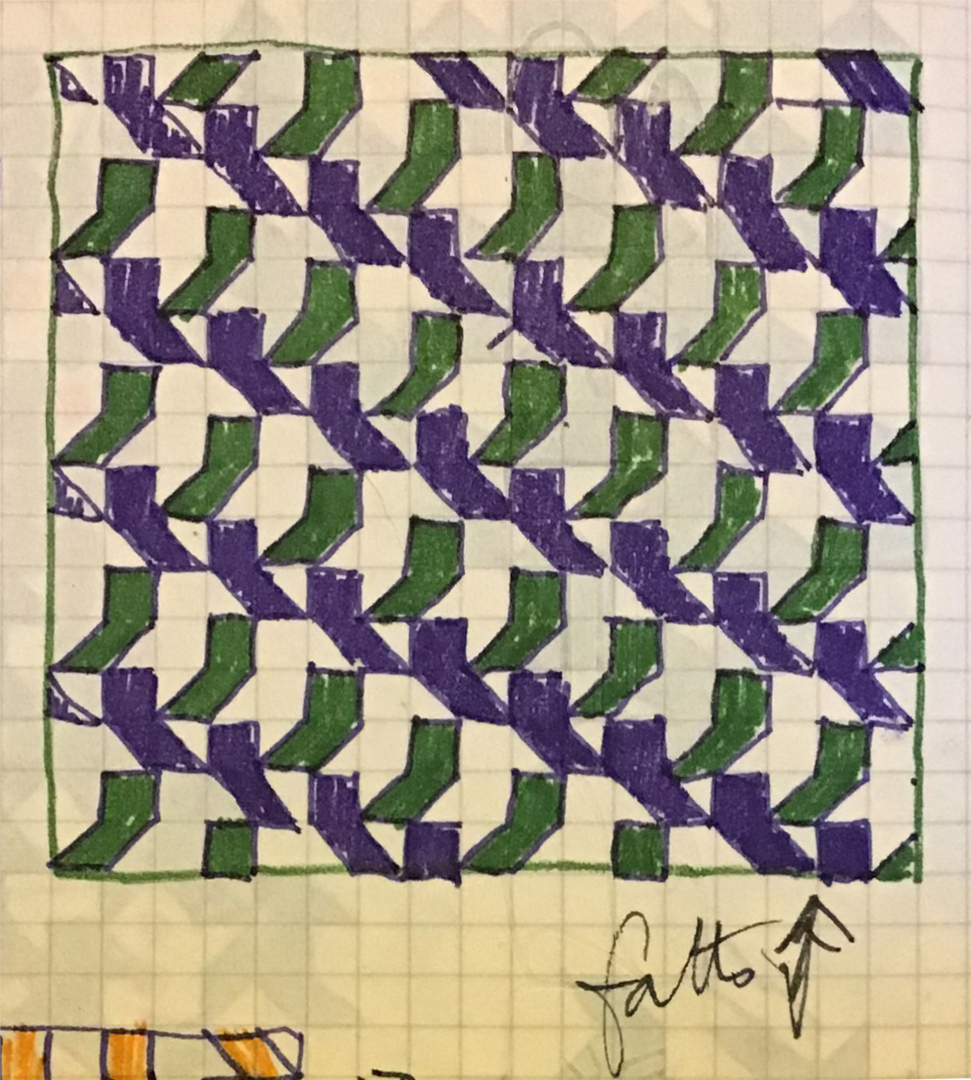
The modular sign at the basis of the entire process is the one shown in the letter above. Franco’s process invariably commenced with a rudimentary sketch in one of his gridded notebooks, where he examined its geometric adaptability in terms of replicating the sign. The basic unit of measurement was always the most straightforward: the single ‘square’. Consequently, this module boasts dimensions of 5×3:
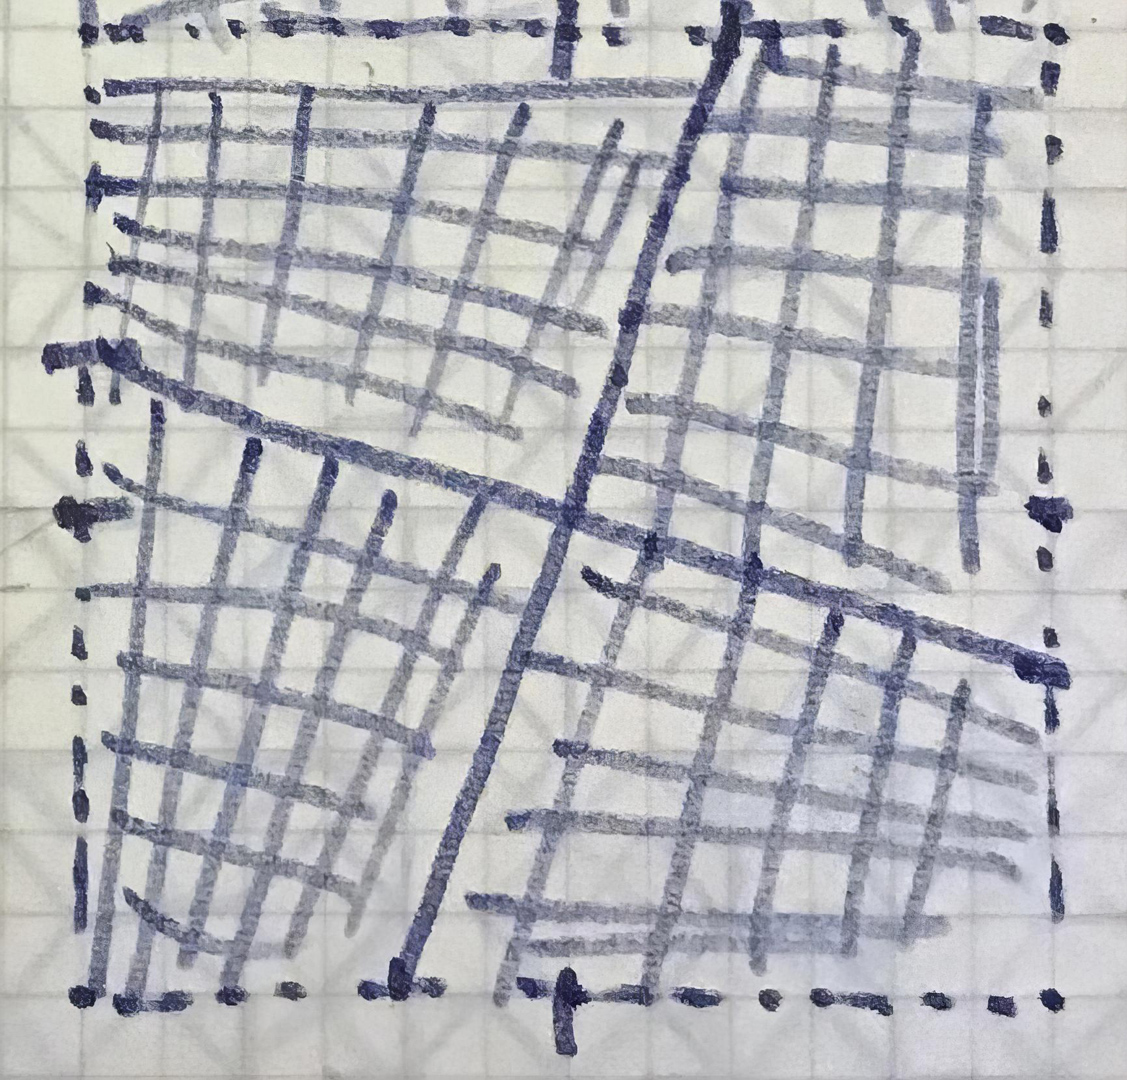
The matrix
Subsequently, the following phase involved duplicating the module in an unaltered matrix, determining the precise spatial placement of the elements within the forthcoming painting. His notebooks contain numerous analogous modules; some culminated in actual paintings (as indicated by ‘fatto‘, which means ‘done’), while the majority remained as thousands of theoretical experiments:
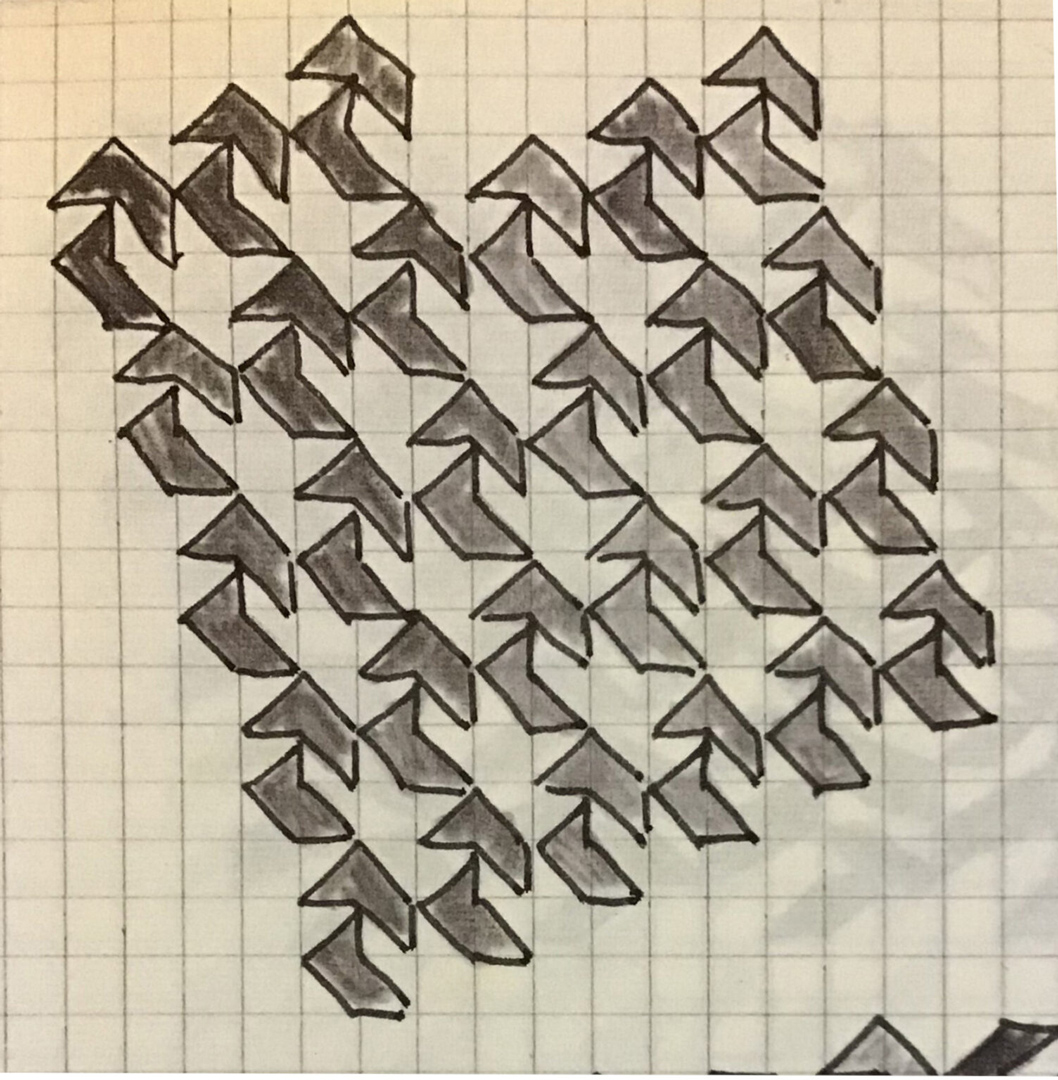
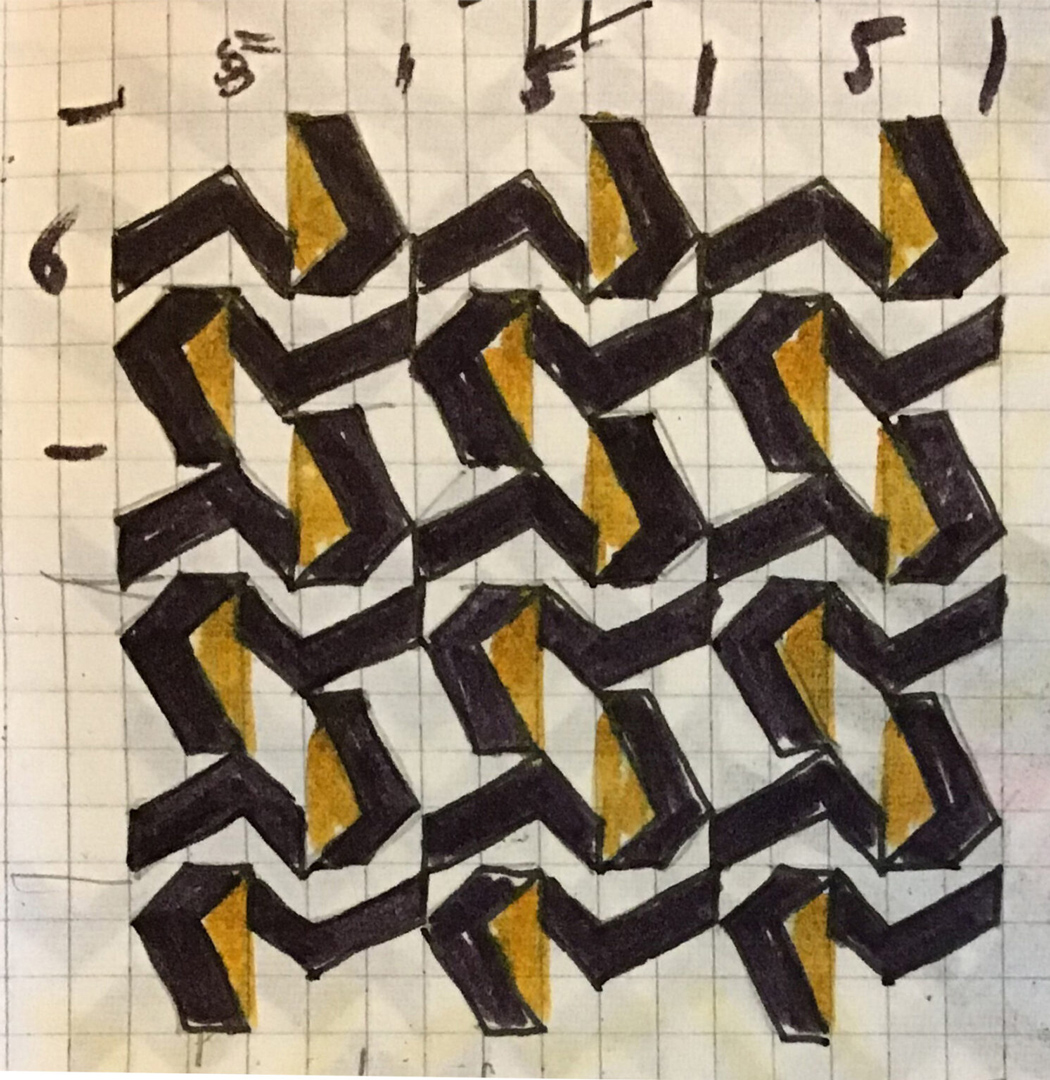
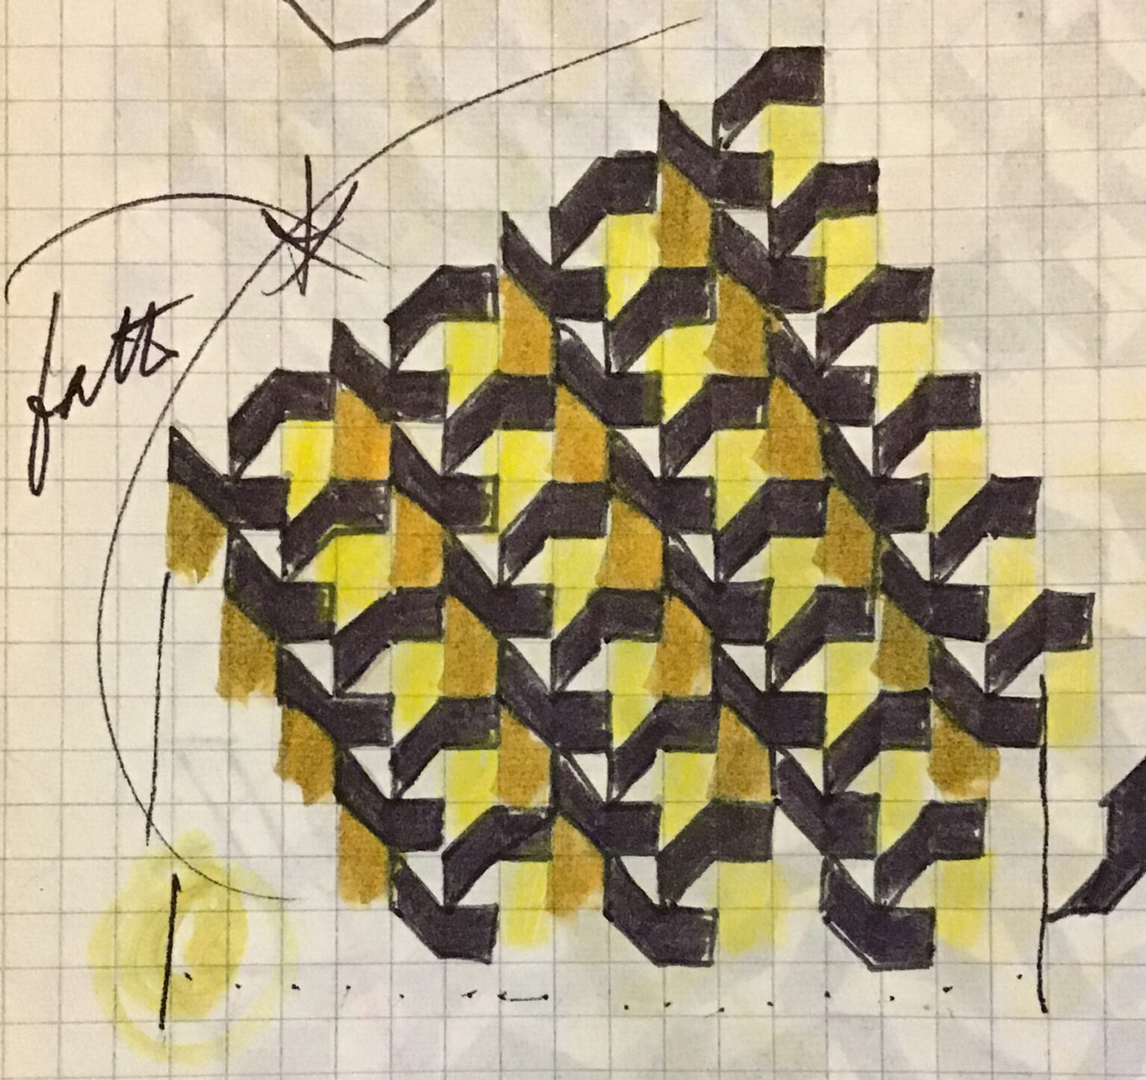
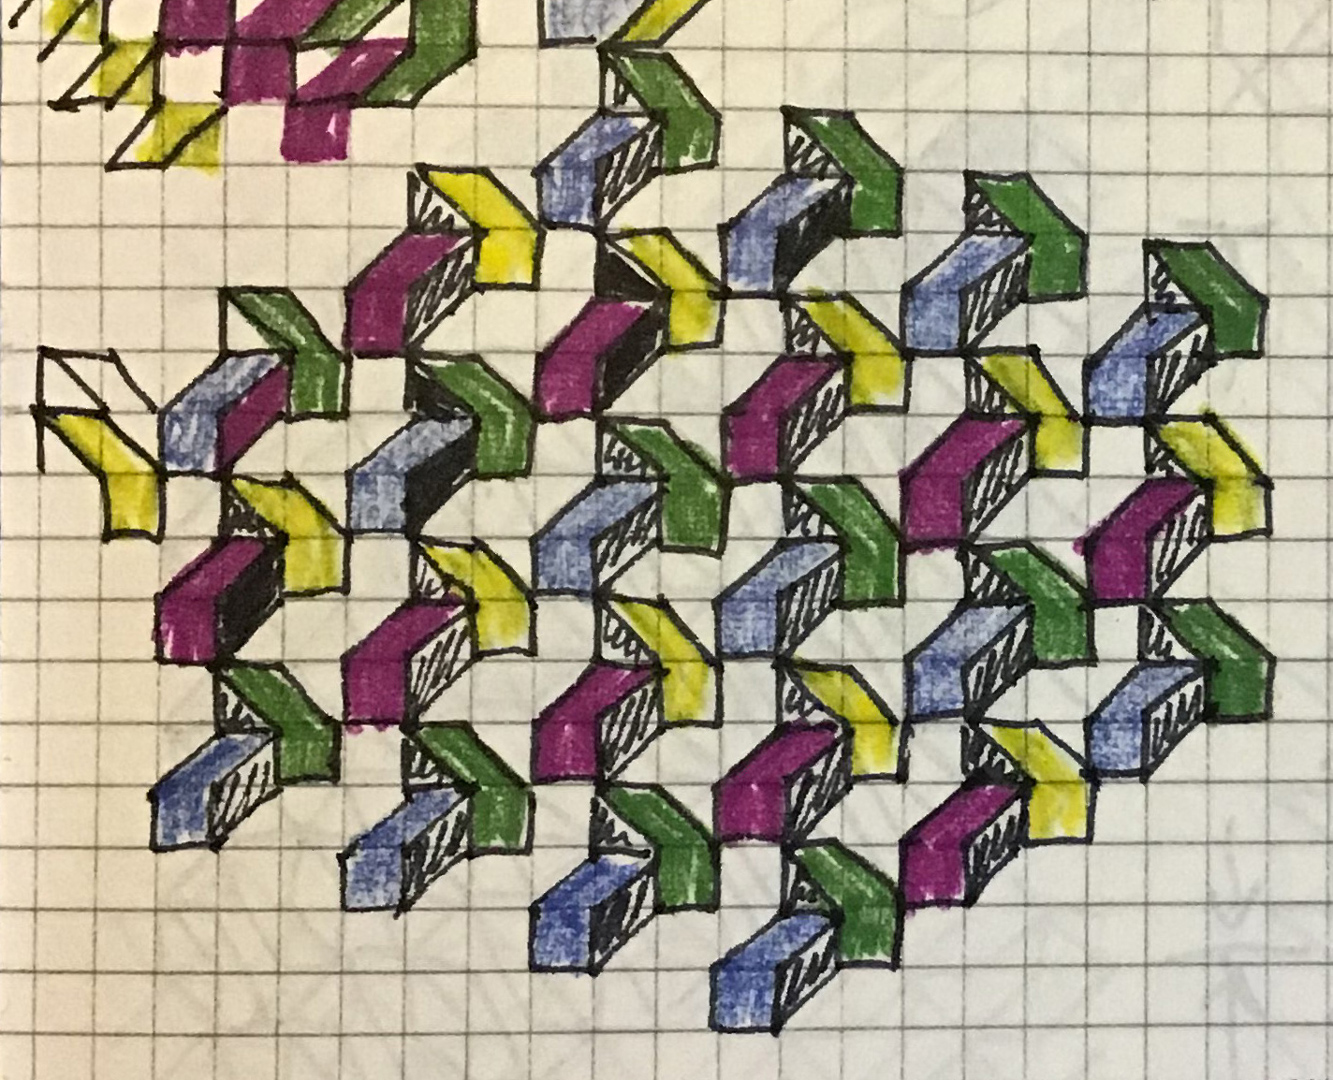
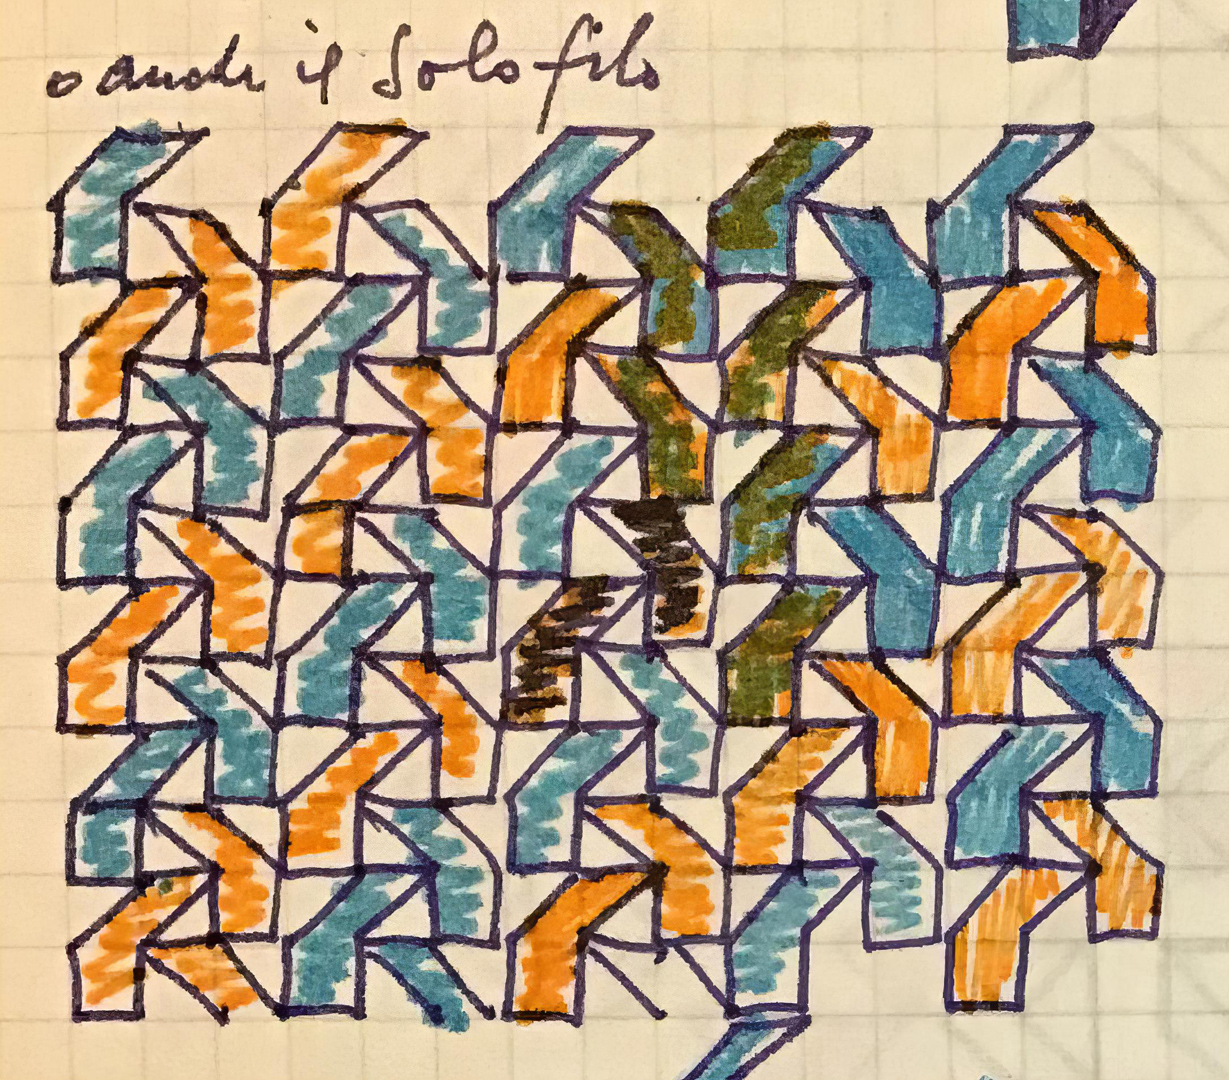
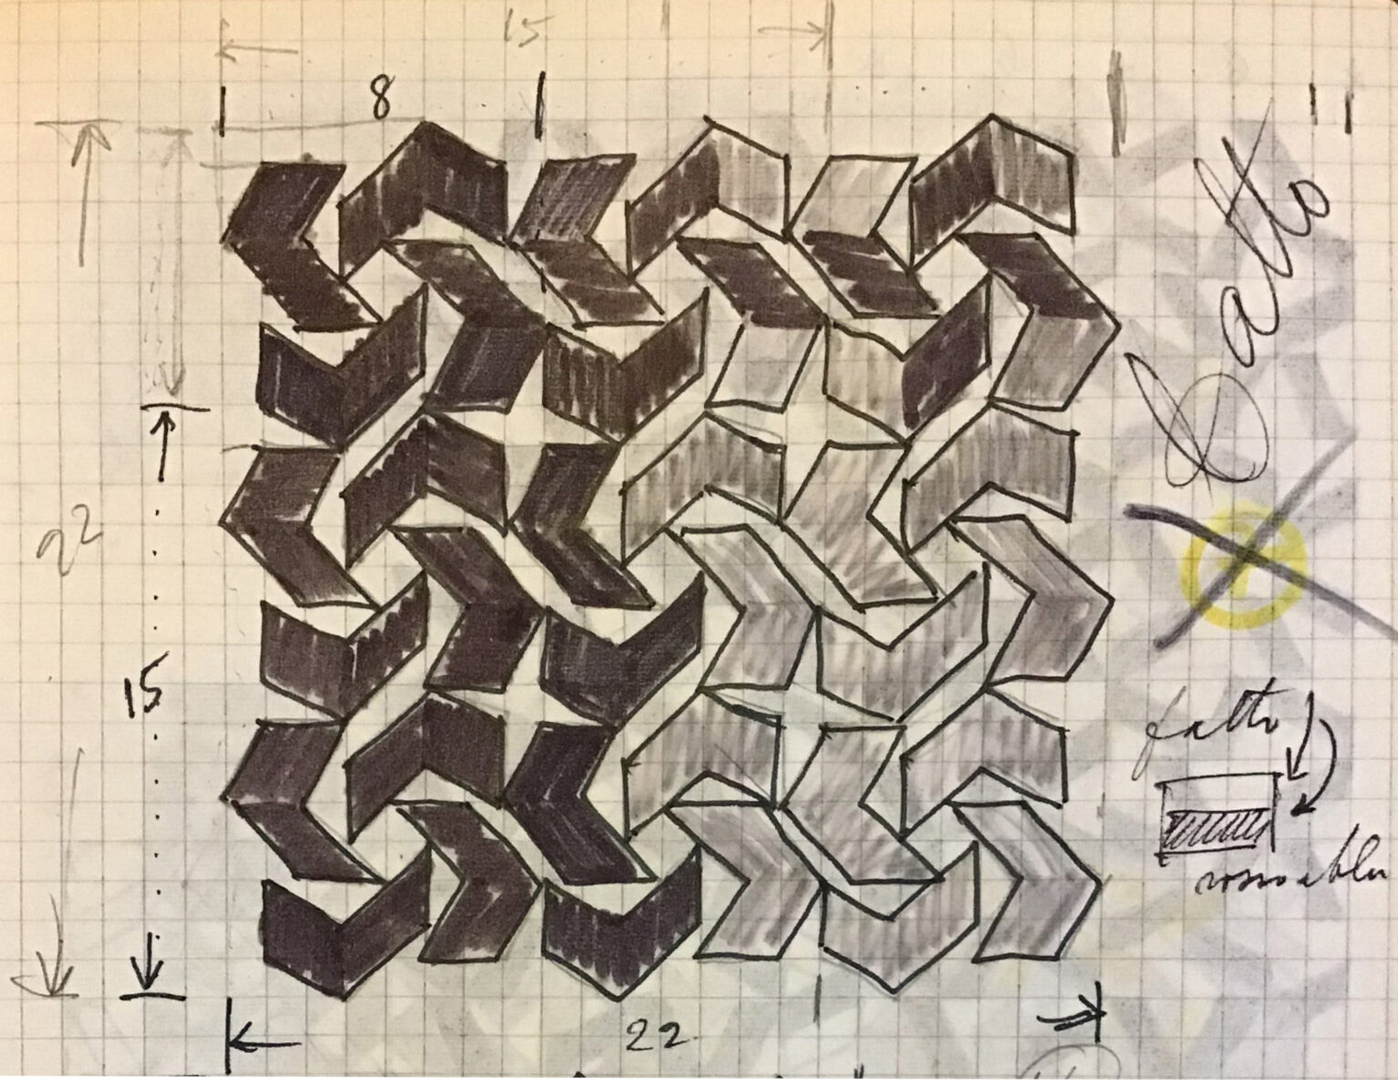
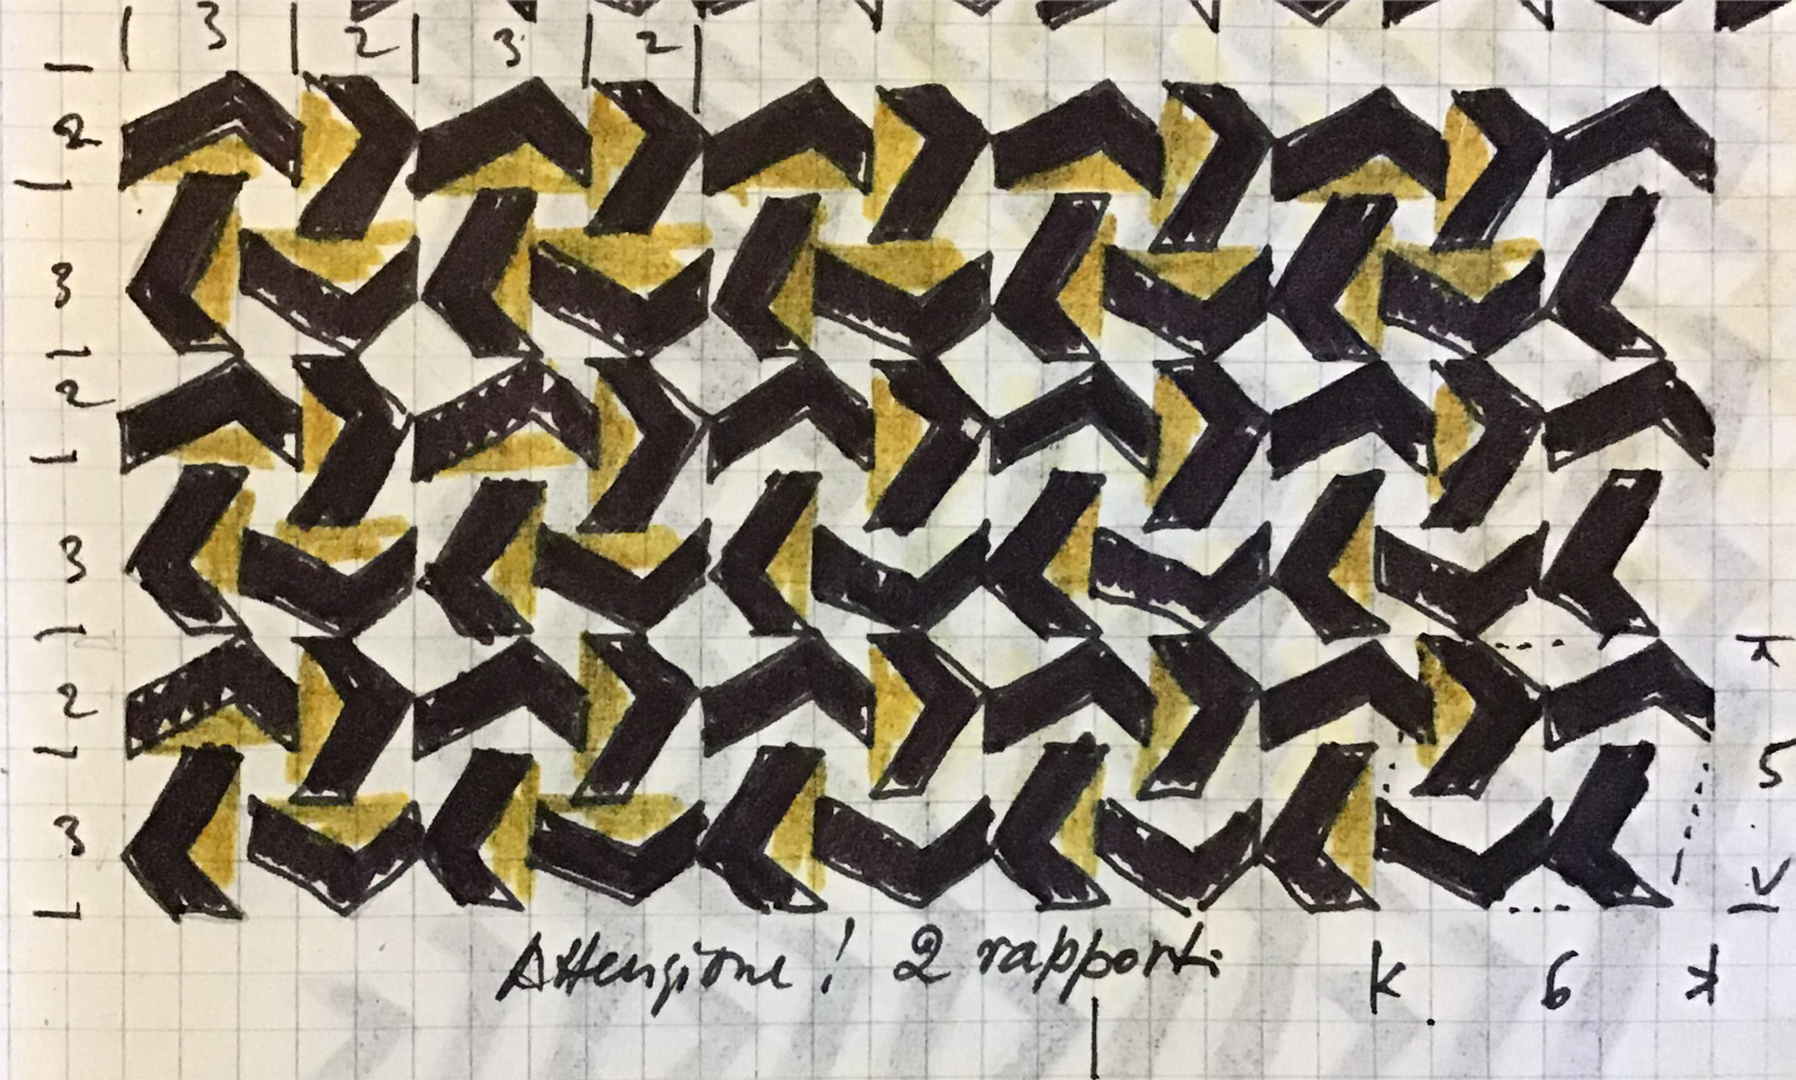
The colour occasionally applied to the sketches wasn’t always meant for actual use; instead, it served to enhance the three-dimensional effect of the matrix.
To generate an undulating effect, the modules in a matrix could NOT be directly stacked on top of one another; instead, they had to be diagonally offset:
The undistorted grid
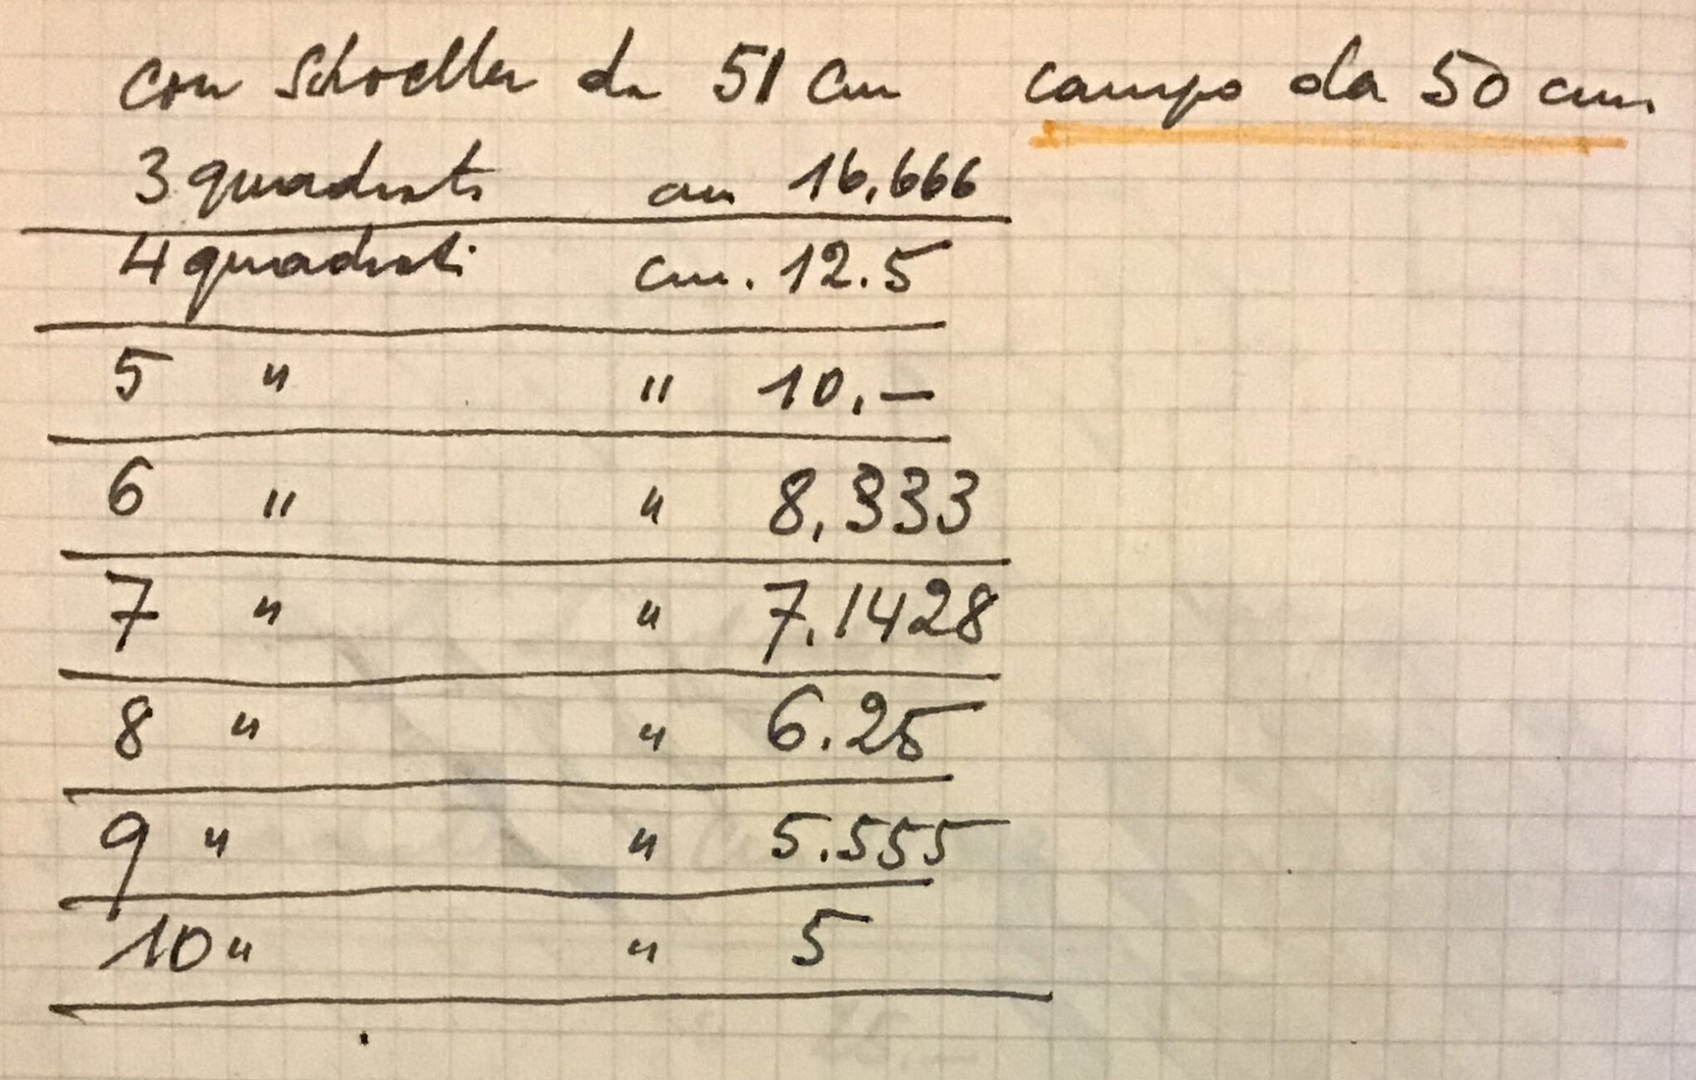
Before proceeding with the distortion process, Franco had to make two more decisions: how many squares (referred to as ‘spazi‘ – ‘spaces’) should divide the cardboard and where the initial module should be placed.
The square size was directly related to the practical width of the cardboard, and Franco meticulously selected frames for his paintings, taking them personally to a nearby framer, the renowned Nino Soldano. He was well aware that a 51 cm square Schoeller cardboard would provide a workable width of 50 cm:
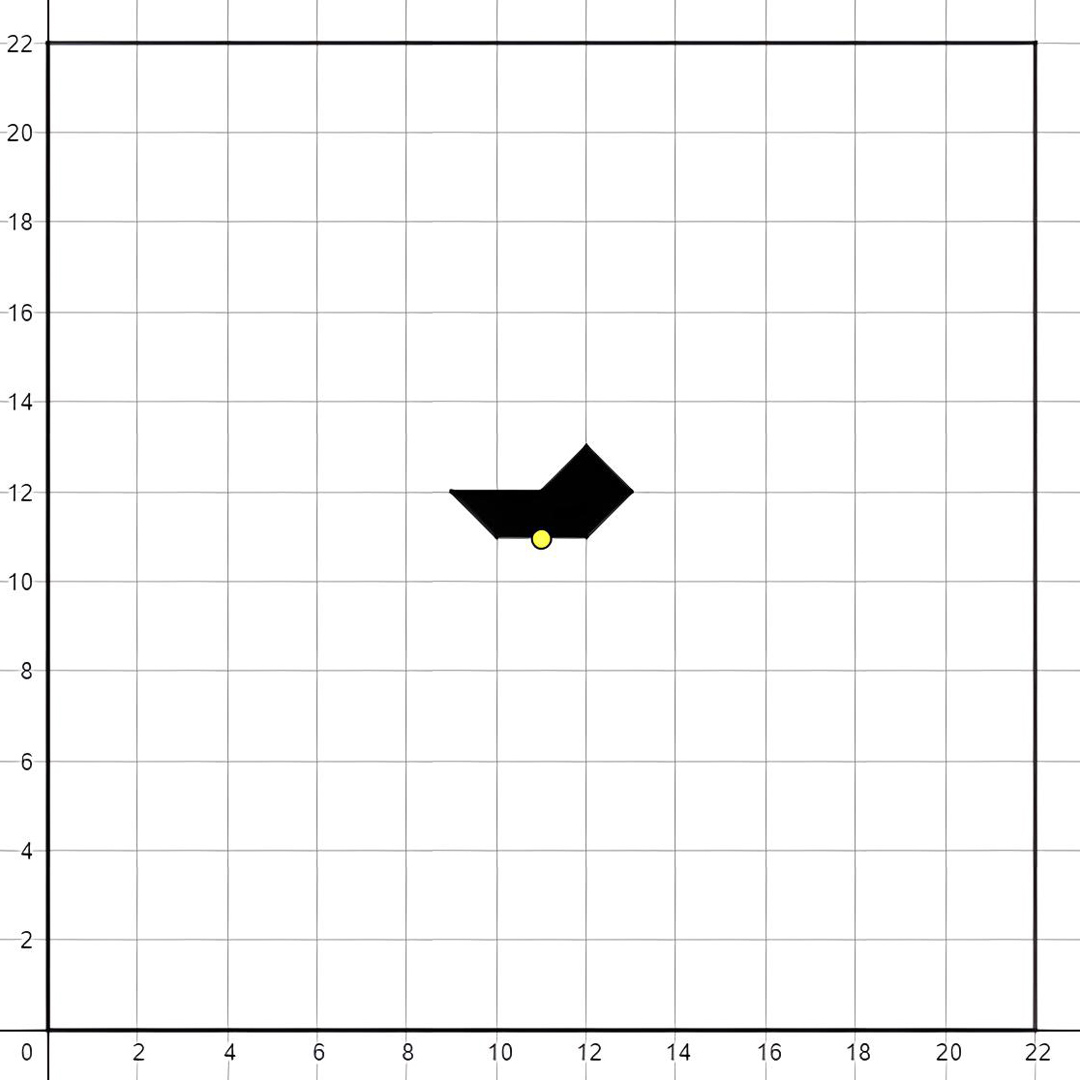
For this particular artwork, Franco decided to divide it into 22×22 spaces. Given the perfect symmetry to the centre of the composition, he chose an even number of squares (11 on the right and 11 on the left of each baseline of the distortion). The first module was thoughtfully positioned at the centre of the grid:
The undistorted positioning
This short video (created using the open-source software GeoGebra) provides an overview of the process of positioning on the undistorted grid starting from the centre. Even though Franco did not have a computer to make such precise tests, he had a clear vision of the process:
The hyperbole
The next phase is undoubtedly the most complex, original, and extremely difficult to decipher for the untrained eye.
Many people assume that he employed some obscure technique to create curved lines – those immediately grasped by the eye – but he achieved the impression of hyperbolic distortion using only straight lines!
In an analysis of the artworks exhibited at the Galleria Spazia in 1982, Grignani himself wrote:
“The twists are not produced by signs in the curve but by the gradual meeting of structures placed diagonally with grid coordinates.”
Franco studied geometry in high school and pursued mathematics for two years at the Faculty in Pavia until 1929. Subsequently, he moved to Turin to study architecture. As a result, he had a profound grasp of mathematical and geometric tools, including conics. Although I was just a child, I acquired these skills by observing him for hours and hours in his indefatigable work in his studio and listening carefully to his every single word. I even found it entertaining to attempt to imitate him in my math notebook during my primary school years, instead of paying attention to my teacher…
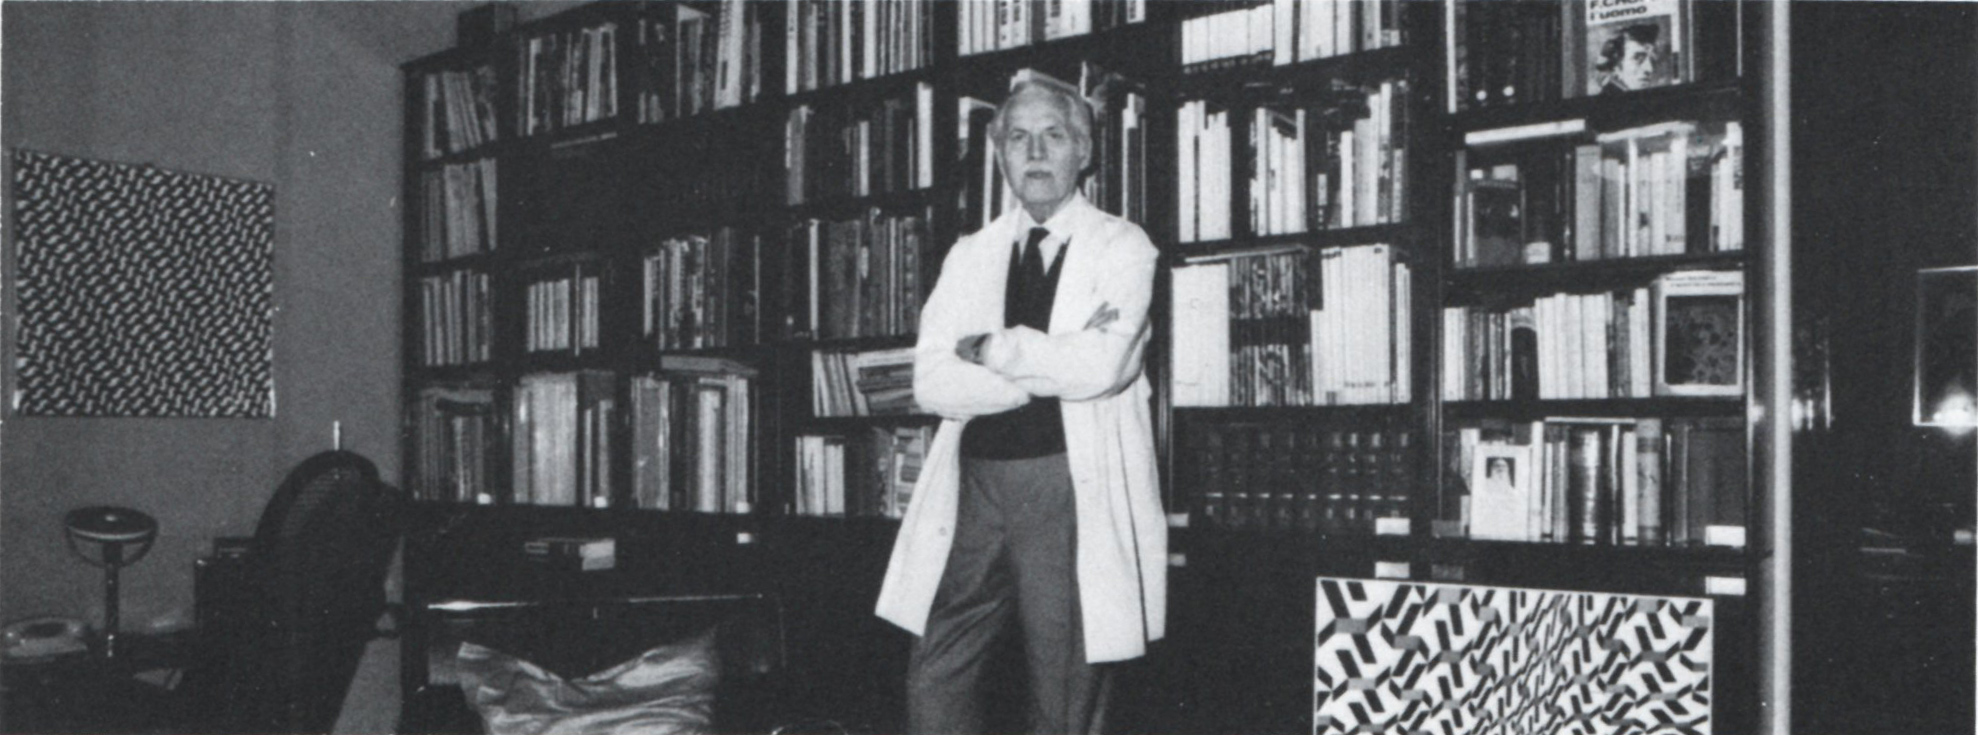
When my grandfather wanted to show me a newly completed painting, he was used to placing it on the floor, leaning it against the bookcase in the living room (see pic above), and telling me: “Don’t just stand in front of it. You have to move, from right to left and then the other way around, and look at it from the corner of your eye. You will always see a different picture in motion!” And so happened, as suggested in the letter above mentioned. So, I invite you to click on the picture below and follow his advice in full-screen mode:
By following his instructions and viewing the artwork from different angles, you’ll perceive a three-dimensional movement created by the geometric distortion, resembling the intersection of two hyperbolic paraboloids:
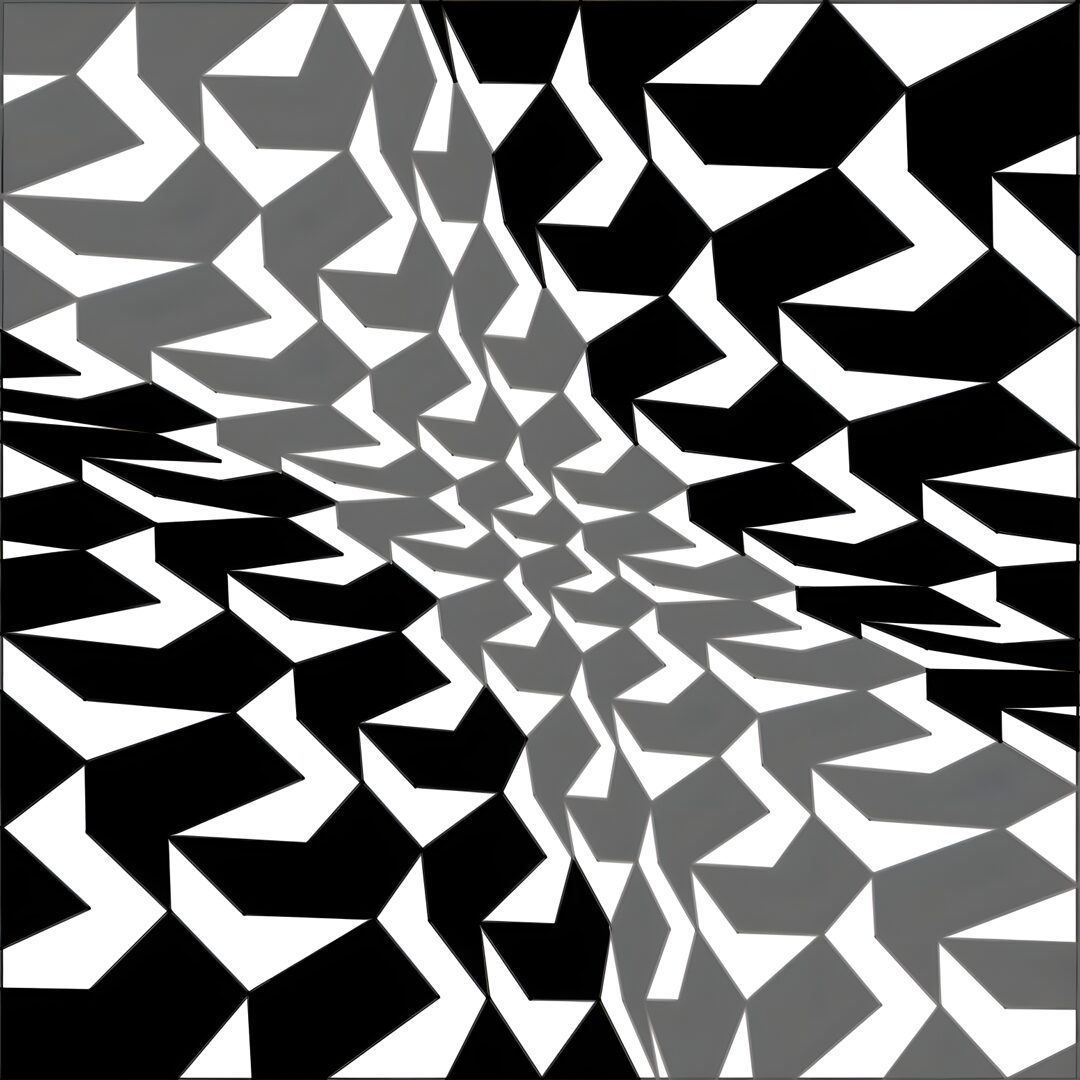
As Grignani himself noted in 1982 regarding hyperbolic tensions, “the three-dimensionality is illusory and comes out from the experience that each of us has on the position of light and its relative shadow.”
Professor of Nuclear Science Giuseppe Caglioti, in the book Simmetrie Infrante (The Dynamics of Ambiguity, cover by Grignani – 1983), provided an insightful description of the sensation when encountering a hyperbolic artwork by Grignani: “To a superficial observer, the work reproduced here could at first appear a two-dimensional geometric drawing, made up of many black and white parallelograms, delimited by clear and sharply defined sides. But after a few moments, these parallelograms reorganize themselves before our eyes; […] the gaze tends to identify and then to follow privileged itineraries, along which the level of attention required remains almost constant. […] After a further period of observation, new perspectives soon explode outside the surface of this painting. […] The result is an alternation of multiple current patterns of the possible structuring of space.”
In the already mentioned exhibition catalogue from Lorenzelli Arte in 1981 (featuring 51 artworks created between 1979 and 1981), Cesare Musatti added: “the onlooker feels as if he were split in half: on the one hand he is dazzled by the precision with which all the figurative elements are repeated, with only a very gradual modification of size, thickness, inclination, and position; on the other hand he is drawn by a vision of the whole which defies any analysis of its details.”
In 1985 the gallerist Michele Caldarelli wrote in the magazine Scienza85: “All of Grignani’s work, in its coherence, represents a continuous fusion of previous experiences with new ones. A final example (and not least to be believed) is the series of hyperbolic structures, which almost totally summarize the previous experiments. A very complex identification of points, spatially determined on the level of each work, generates hyperbolic spaces, which fluctuate due to an illusory variation of brightness, but also due to a changed spatial interpretation and anamorphic effect if they are not observed from the front. The result is a polycentric and absolutely unstable universe of signs, yet ordered within a dynamic symmetry that reconciles, in a visual image, the illusions of time and space that are real and perceptible only when their mutual interference manifests itself in becoming a world, whose further ‘N’ dimensions are yet to be discovered.”
The grid
So, how did Franco actually create a hyperbolic impression by using only simple straight lines?
If we were to highlight only the vertices of the many polygons in the painting above, we would get this pic:
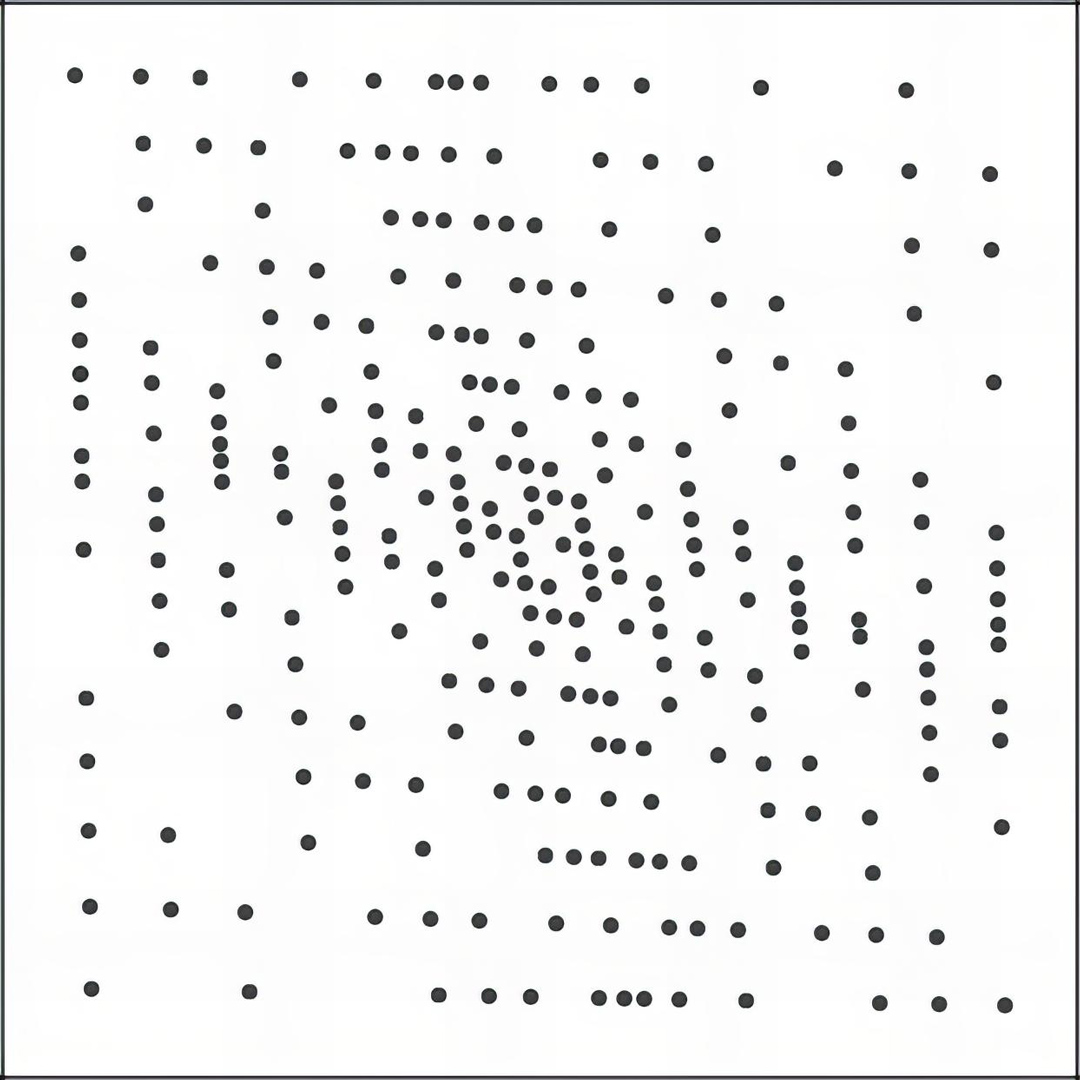
Nonetheless, the curvilinear appearance is still prominent. Let’s attempt to set aside the curves and, instead, concentrate on connecting these points with straight lines…
And that’s the key:
Franco utilized a series of grids (reticoli) which were peculiar in being easily adaptable to different matrices and cardboard sizes. Once again, his process was simple; each grid had its own name, often inspired by cities (both Italian and international, like Pavia, Milano, Roma, Londra, Chicago, etc. but also Melitopol, in honour of the hometown of his wife Jeanne Michot), sometimes followed by a letter (A, B, C) to identify some specific variations.
This painting is peculiar because the sequence of the spaces is perfectly symmetrical on the four sides of the 50×50 cm square. However, as indicated in the sketches below, the solutions often involved considerably more complex grids:
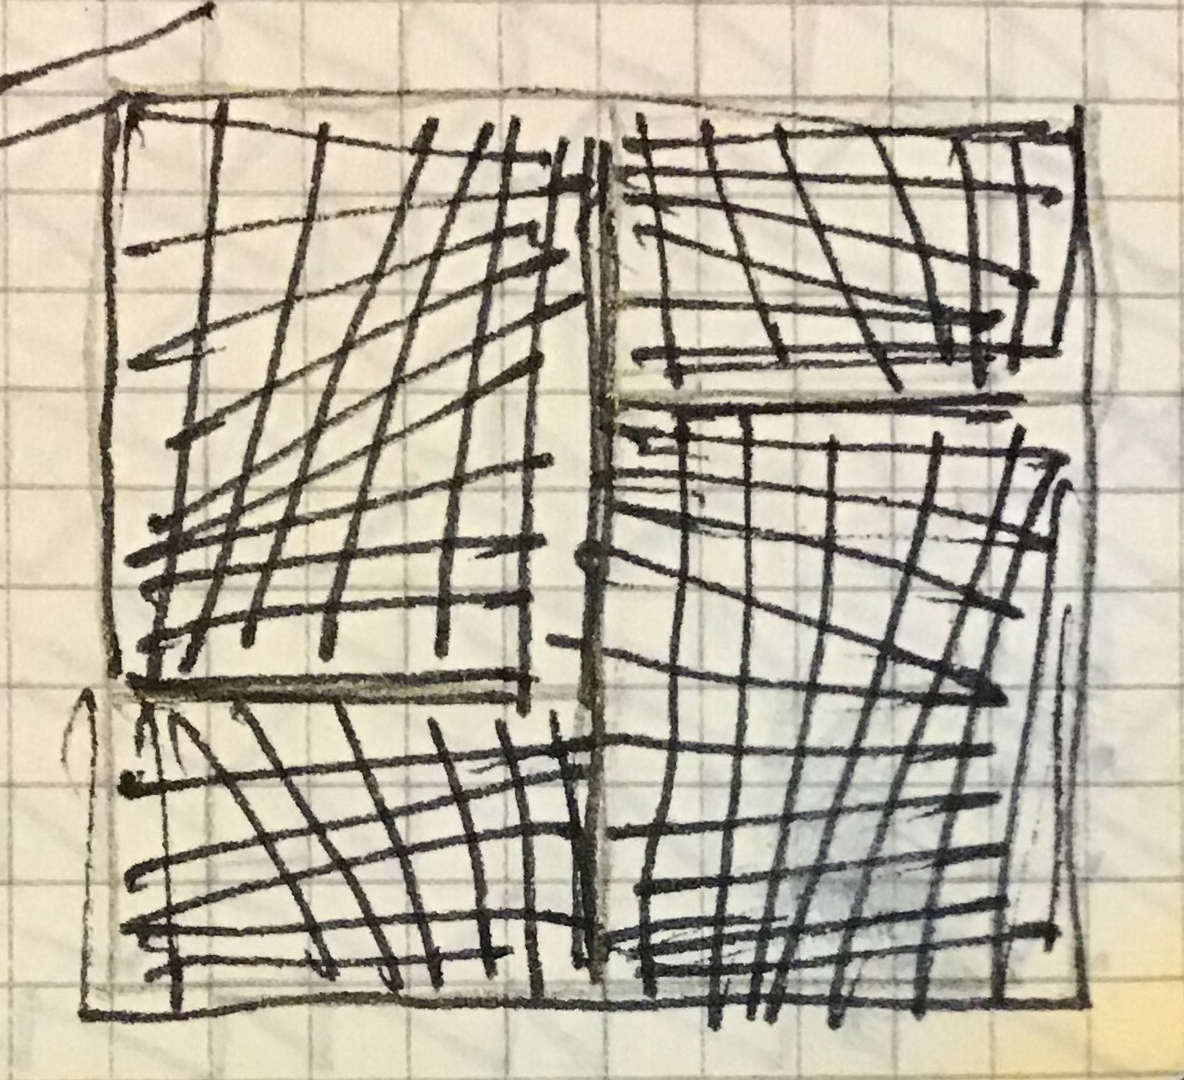
Using tracing paper superimposed on the grids, he could rapidly assess the overall effect:
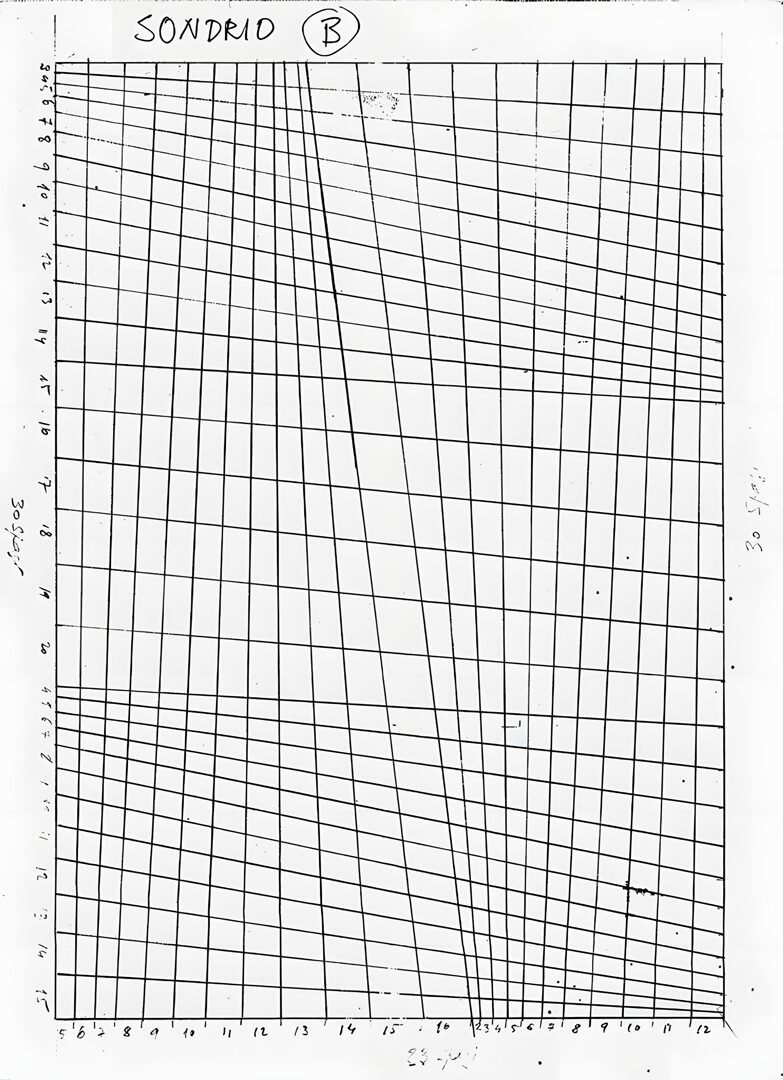
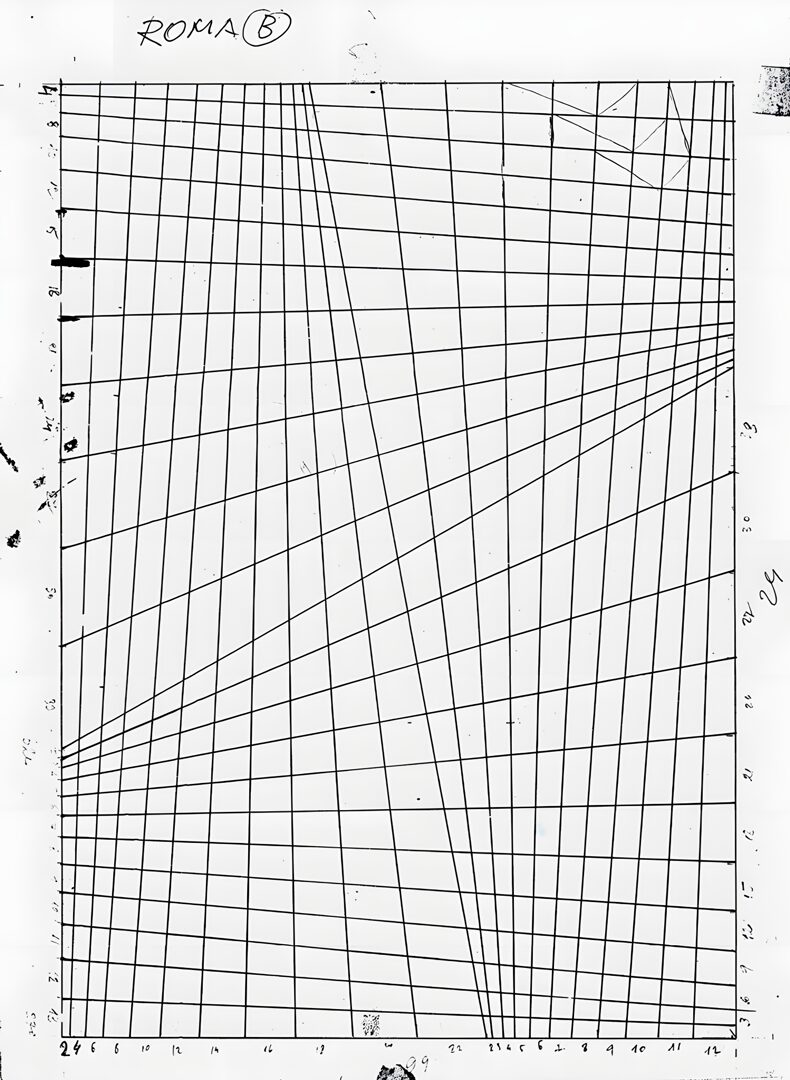
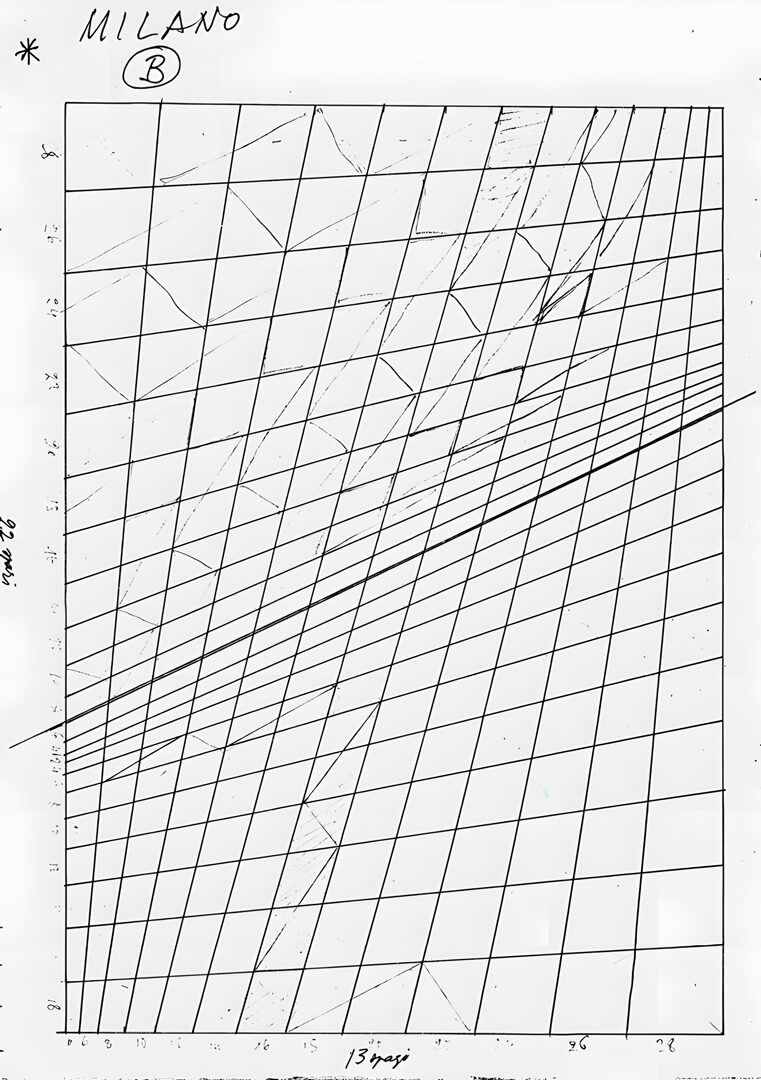
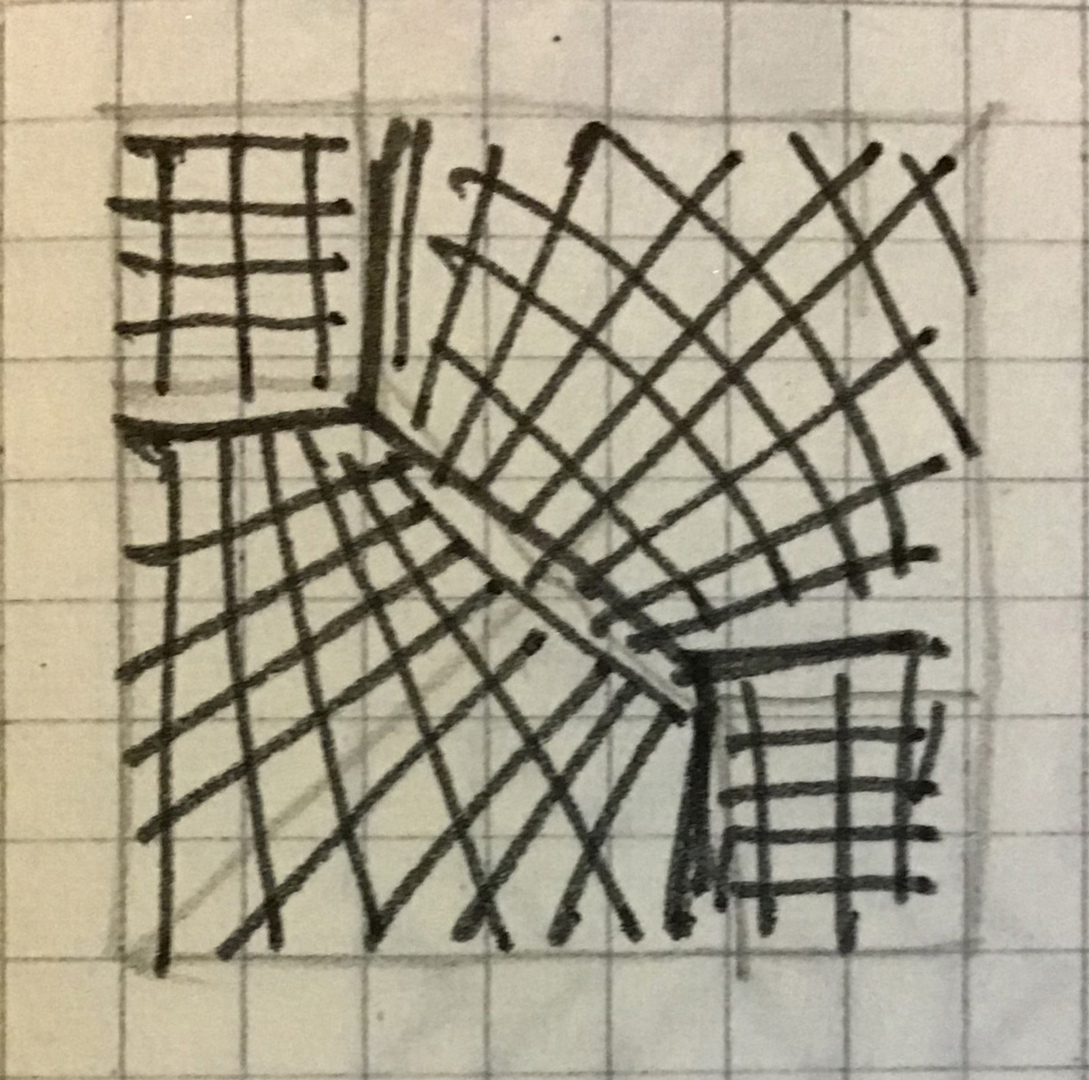
The spaces in the distorted grid of this painting, therefore, remain at 22 but no longer have the same width as when they were simple equal squares, as explained above. Each type of grid had its own set of widths. Franco, as usual, opted for the simplest solution, using integers, which allowed him to adapt the same grid to cardboard pieces of various sizes.
For this grid, the sequence is: 14-13-12-11-10-9-8-7-6-5-4-3-2-3-4-5-6-7-8-9-10-11, for a total of 167 units. On a useful width of 50 cm, this means that one unit is 3 mm long. Therefore, for example, the first space is 14 x 3 = 42 mm long: you will need a very sharp pencil and excellent eyesight to accurately trace all the lines without any errors!
This method approximated a vanishing point of the lines (four in this painting) that Franco could not practically use since it was too distant from the cardboard itself.
The whole process is well summarized in this second short video:
How comes the visual 3D effect?
The main outline points of the distorted grid can be seen as projections onto a plane of a quadrilobate curved undistorted grid. When we view this distorted linear grid, our eyes interpret it as a curved deformation in the three-dimensional space of an undistorted grid. This interpretation creates the illusion of depth and three-dimensionality in the artwork:
Franco Grignani exhibited his hyperbolic works in at least six important exhibitions: in 1981 in Milan, in 1982 in Bologna, in 1984 in Venice, in 1985 in Como, and again in Milan in 1988 and in 1991. More hyperbolics can be seen in the Gallery.
As early as in 1971 in the magazine Linea Grafica, Grignani stated:
“If you intervene by shifting your attention to a different, eccentric point, you automatically create a state of mind of tension that multiplies interest and communication and becomes stronger to the extent that it can cause a sort of physical discomfort.“
Two years later, in a 1973 interview for the magazine Linea Grafica, he declared:
“It’s not that I argue that we see wrong: we just can’t see. When one looks at a painting and understands it in its entirety, as long as he simply looks at it, he forgets it because he does not participate. When does one participate? When in the object, in the painting he finds something that he lacks. Then I carry him inside my structures as in a labyrinth. And of this labyrinth, the observer wants to find the solution, so he is forced to actively participate without ever being able to find sufficient justification. […] I don’t believe in improvisation. I want to check, as much as possible, every phenomenon. In my paintings, there is an elaboration that arises precisely from this premise. Many investigations were abandoned even after long work because they did not develop the phenomenon I was looking for. They told me that mine was a substantial exhibition: but how many works have never become paintings because I had to leave on the way! Thus, what I have displayed is only the smallest part of what I have designed.“
Also related:
“Hyperbolicity” – attachment to the update volume of the Encyclopedia of Science and Technology 1986/87 (ITA):
[*] courtesy of Daniela Grignani
[a] “Franco Grignani”, catalogue n°42, Lorenzelli Arte, 1988 (photo by Cordini)
[due to the fact that up to now no one else – not even within Franco’s family – has ever been aware of these techniques in detail, the text, pics and videos with GeoGebra in this post are strictly licensed under CC BY-NC-ND 4.0: this means they can be reproduced as they are, as long as the author’s name (Emiliano Camera) and the source (www.francogrignani.info) are mentioned, they are not used for commercial purposes, and they are shared with the same license; the ‘reverse engineering’ method through the vertices of the polygons is CC BY-NC-ND 4.0 Emiliano Camera; the original technique is © Franco Grignani and can not be applied to replicate artworks: bots are used to detect infringements; pics from Franco Grignani are all © Eredi Franco Grignani]
Last Updated on 19/06/2024 by Emiliano